
Corn price, live chart and what moves the market
Corn is one of the most widely grown and most actively traded agricultural commodities on the planet. It feeds livestock, fuels cars as ethanol, sweetens processed food and underpins entire export economies, so its price is watched by farmers, food companies, energy traders and central bankers alike. The standard benchmark is the CME Group corn futures contract (ticker ZC), priced in U.S. cents per bushel and traded in Chicago around the clock on most weekdays. The live chart on this page tracks that benchmark, so you can follow the price in real time and study the technical picture without an account or a sign-up.
What makes corn interesting is how physical it is. There is no central bank that prints more corn. The supply each year comes out of the ground, mostly between spring planting and autumn harvest, which means weather and acreage decisions dominate the conversation. The United States is the largest single producer and exporter, so the U.S. growing season tends to set the tone for the whole world market, even though Brazil, Argentina, China and Ukraine all matter to the global balance.
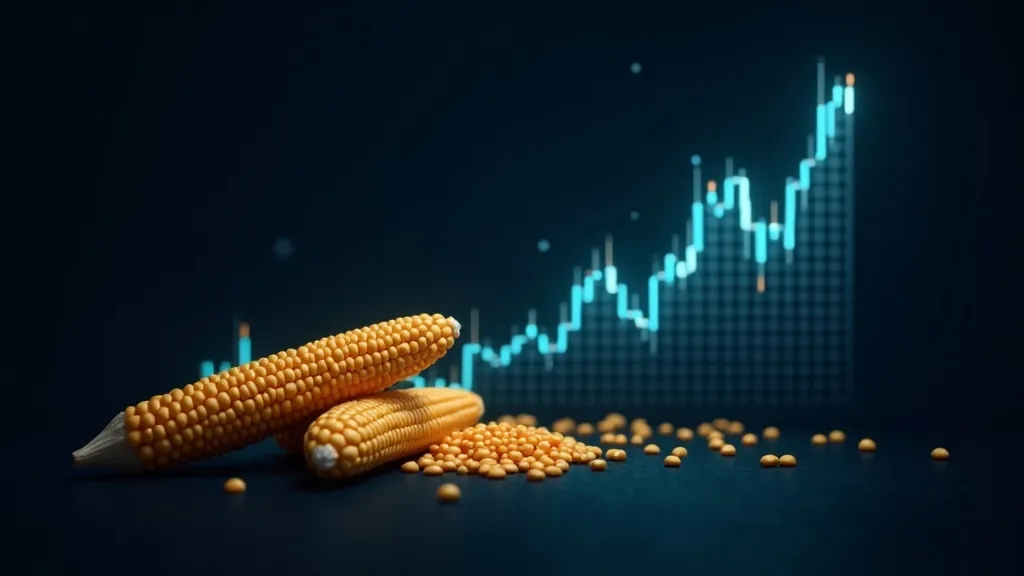
What drives corn prices
U.S. weather and yields. This is the single biggest swing factor in the short term. Corn is sensitive to heat and drought during pollination in midsummer, so a dry, hot July can shave bushels off the national yield and lift prices fast. Too much rain at planting can delay the crop and cut acreage. Traders watch crop-condition ratings, rainfall maps and temperature forecasts obsessively from June through August.
Ethanol demand. A large share of the U.S. corn crop is turned into fuel ethanol, recently around a third of total domestic use. Because ethanol is blended into gasoline, corn demand from this channel rises and falls with fuel use and with the price of crude oil. U.S. ethanol exports have also climbed to record levels recently, adding another source of demand that did not exist at this scale a decade ago.
Livestock feed demand. Corn is the workhorse feed grain for cattle, hogs and poultry. When herds expand and meat demand is strong, more corn gets eaten, which supports the price. When feed costs squeeze ranchers and herds shrink, that demand softens.
Exports and global competition. The U.S. competes head-to-head with South American suppliers, and a big Brazilian or Argentine harvest can pull export business away from American farmers. Trade policy, tariffs and shipping disruptions all feed into who sells to whom.
The U.S. dollar. Corn is priced in dollars, so a stronger dollar makes U.S. corn more expensive for foreign buyers and tends to weigh on prices, while a weaker dollar makes American grain more competitive abroad. This is the same currency effect that shapes all markets priced in dollars.
Seasonality and the USDA reports
Corn has a pronounced seasonal rhythm. Prices are often relatively quiet early in the year, then volatility builds through April and May as planting gets underway, peaks during the June-to-August weather window when crop stress can move the market hardest, and frequently eases into the autumn harvest when supply floods in. Over many years, new-crop prices have tended to drift lower between the spring outlook and the end of harvest, though any single season can break the pattern entirely.
The most important scheduled events are the USDA reports. The monthly WASDE (World Agricultural Supply and Demand Estimates) updates forecasts for production, use and ending stocks, and it can jolt the market when the numbers differ from what traders expected. Lower-than-expected ending stocks are generally bullish; larger stocks are bearish. The spring Prospective Plantings report and the summer crop-condition updates are also major catalysts. If you trade or simply watch corn, the report calendar matters as much as the weather.
How to read the chart
The chart above plots corn futures over time using candlesticks. Each candle covers one slice of time, say a day: the body shows where price opened and closed, and the thin wicks mark the high and low. A run of rising candles with higher highs and higher lows signals an uptrend; the reverse points down; a sideways drift means the market is undecided, which for corn often happens between report dates and outside the growing season.
Two simple tools cover most of the basics. A moving average smooths price into a single line, helping you see the broader trend through the daily noise. Support and resistance are price levels where buyers or sellers have repeatedly stepped in, acting like a floor and a ceiling until one finally gives way. Switch the timeframe to match your question: an intraday view reacts to a single WASDE release, while a multi-year view shows the long boom-and-bust cycles that follow big harvests and droughts. Remember that indicators describe what has already happened rather than predict the future, and corn can gap sharply around report releases.
Corn does not trade in isolation. It moves alongside other grains, so it is worth comparing it with wheat and scanning the rest of all markets to see how the dollar, oil and the broader agricultural complex are leaning.
Information only. Nothing on this page is investment advice, and market data can be delayed or imperfect. Do your own research before making any financial decision.
Frequently asked questions
What unit is the corn price quoted in?
The CME corn futures benchmark (ticker ZC) is quoted in U.S. cents per bushel. One contract covers 5,000 bushels, so a one-cent move equals 50 dollars per contract.
What moves corn prices the most?
U.S. summer weather and yields are the biggest short-term driver. Ethanol demand, livestock feed demand, exports versus South American competition and the strength of the U.S. dollar all matter too.
Why does corn react to oil and ethanol?
A large share of the U.S. crop becomes fuel ethanol that is blended into gasoline. When crude oil and fuel demand rise, ethanol and corn demand often follow, linking the grain to energy markets.
When is corn most volatile?
Volatility tends to build through spring planting and peaks in the June-to-August weather window, when heat and drought during pollination can sharply change yield expectations.
What is the WASDE report and why does it matter?
The WASDE is a monthly USDA estimate of supply, demand and ending stocks. When the figures differ from expectations the market can move fast, with smaller stocks bullish and larger stocks bearish.
Is any of this investment advice?
No. speedor.net shows corn market data and charts for information only. Always do your own research and consider professional guidance before making financial decisions.